
Learn how to configure Prometheus and monitor metrics in 5 easy steps using Istio
More often than not configuring workload metrics is just ignored, and there is a fundamental reason why… we just want to stick to the business functionality we are trying to implement and we likely just see metrics on a lower priority, it is because it takes time to implement the instrumentations needed in our app to expose the metrics.
What is Prometheus?
Prometheus is a time series DB used as a metrics-based monitoring system. PromQL is Prometheus functional query language that allows users to aggregate time series data in real time.
Prometheus provides an extensive list of client libraries here for instrumenting code to expose metrics. Often this is a concern left for later and unless needing to track a custom metric aligned with the nature of the business requirement, tracking basic metrics like the related to synchronous communication are implemented in a third party library, system or not at all.
Istio provides the ability out of the box to scrape prometheus metrics exposed over the Envoy-proxies to be used by a Prometheus instance.
In this quick hands-on post we are going to configure Prometheus and monitor metrics in 5 easy steps using Istio’s out of the box observability capabilities.
Prerequisites
- A kubernetes cluster
- Istio installed
istioctlCLI tool installed
Steps
1. Deploy your workload
We are going to use Istio’s hello-word app as an example workload:
kubectl apply -f https://raw.githubusercontent.com/istio/istio/master/samples/helloworld/helloworld.yaml -l service=helloworld
kubectl apply -f https://raw.githubusercontent.com/istio/istio/master/samples/helloworld/helloworld.yaml -l version=v1
This service has two versions, for the purpose of this article we are just using one. Test that your service is working properly after the pods are ready:
export HELLOWORLD_POD=$(kubectl get pod -l app=helloworld -ojsonpath='{.items[0].metadata.name}')
kubectl exec $HELLOWORLD_POD -it -- curl localhost:5000/hello
You should get a response like:
Hello version: v1, instance: helloworld-v1-776f57d5f6-ww425
2. Check metrics
If you inspect the hello-world source you can see is a simple Python app with no instrumentation for metrics. You can also check the docker file here.
If you wanted to add instrumentation for metrics to this service and specifically if you wanted to use Prometheus then you will have to use Prometheus client libraries to add to the Python source code to expose this metrics, here you can find a simple example using Python’s prometheus-client that explicitly exposes metrics over port 8000.
Because we don’t have the instrumentation described above then we can’t check metrics on the usual port:
kubectl exec $HELLOWORLD_POD -it -- curl localhost:15090/stats/prometheus
Most likely you would get a response like:
curl: (7) Failed to connect to localhost port 15090: Connection refused
Or any port for that matter, so now lets delete this deployment and annotate the default namespace for sidecar injection in order for Istio to add an Envoy sidecar proxy to this service when we re-deploy:
kubectl delete -f https://raw.githubusercontent.com/istio/istio/master/samples/helloworld/helloworld.yaml
Annotation:
kubectl label namespace default istio-injection=enabled
Re-deployment:
kubectl apply -f https://raw.githubusercontent.com/istio/istio/master/samples/helloworld/helloworld.yaml -l service=helloworld
kubectl apply -f https://raw.githubusercontent.com/istio/istio/master/samples/helloworld/helloworld.yaml -l version=v1
Checking pods are up:
kubectl get pod
Notice now we have two containers per pod. Now export the v1 pod name to the HELLOWORLD_POD variable for later usage:
export HELLOWORLD_POD=$(kubectl get pod -l app=helloworld -ojsonpath='{.items[0].metadata.name}')
Lets try getting metrics again:
kubectl exec $HELLOWORLD_POD -it -- curl localhost:15090/stats/prometheus
You should be able to see a long list of metrics being exposed on this endpoint.
3. Check annotations
Now that the metrics are validated to be exposed over the endpoint /stats/prometheus and port 15090, lets check the pod’s annotations to find out how the Prometheus backend (Service scrapers) get metrics from these endpoints:
kubectl get pod $HELLOWORLD_POD -o jsonpath='{.metadata.annotations}'
You should be able to see an output similar to this:
{"kubectl.kubernetes.io/default-container":"helloworld","kubectl.kubernetes.io/default-logs-container":"helloworld","prometheus.io/path":"/stats/prometheus","prometheus.io/port":"15020","prometheus.io/scrape":"true","sidecar.istio.io/status":"{\"initContainers\":[\"istio-init\"],\"containers\":[\"istio-proxy\"],\"volumes\":[\"istio-envoy\",\"istio-data\",\"istio-podinfo\",\"istio-token\",\"istiod-ca-cert\"],\"imagePullSecrets\":null,\"revision\":\"default\"}"}
Notice how the prometheus annotations are indicating how to access the metrics and if this pod should be scraped at all:
"prometheus.io/path":"/stats/prometheus","prometheus.io/port":"15020","prometheus.io/scrape":"true"
4. Deploy a Prometheus backend
Now that we have everything orchestrated from the workload side of the house, lets deploy a Prometheus instance to work along with istio to collect these metrics:
kubectl apply -f https://raw.githubusercontent.com/istio/istio/release-1.10/samples/addons/prometheus.yaml
This instance should go up in the form of a pod on the istio-system namespace:
kubectl get pods -n istio-system
You can use the Istio CLI tool to access the Istio’s Prometheus instance:
istioctl dashboard prometheus
You should expect your terminal to open a new browser window with the Prometheus UI:
5. Explore metrics over Prometheus UI using PromQL
Before exploring further metrics on the Prometheus UI, lets generate some traffic to get custom Istio metrics generated out of our service envoy-proxy.
This time instead of accessing the endpoint exposed from the pod directly, we are going to send a request from a sample pod service on the same namespace named sleep, This is just for the purpose of generating traffic from one service to another.
For this lets deploy the sleep service:
kubectl apply -f https://raw.githubusercontent.com/istio/istio/master/samples/sleep/sleep.yaml
Capture the sleep pod’s name:
export SLEEP_POD=$(kubectl get pod -l app=sleep -ojsonpath='{.items[0].metadata.name}')
Test you can curl from the sleep pod to the hello-world pod:
kubectl exec $SLEEP_POD -it -- curl helloworld:5000/hello
You should get a response like:
Hello version: v1, instance: helloworld-v1-776f57d5f6-gpcrc
Make sure you hit that endpoint a couple of times to generate some load, then go to the Prometheus UI:
istioctl dashboard prometheus
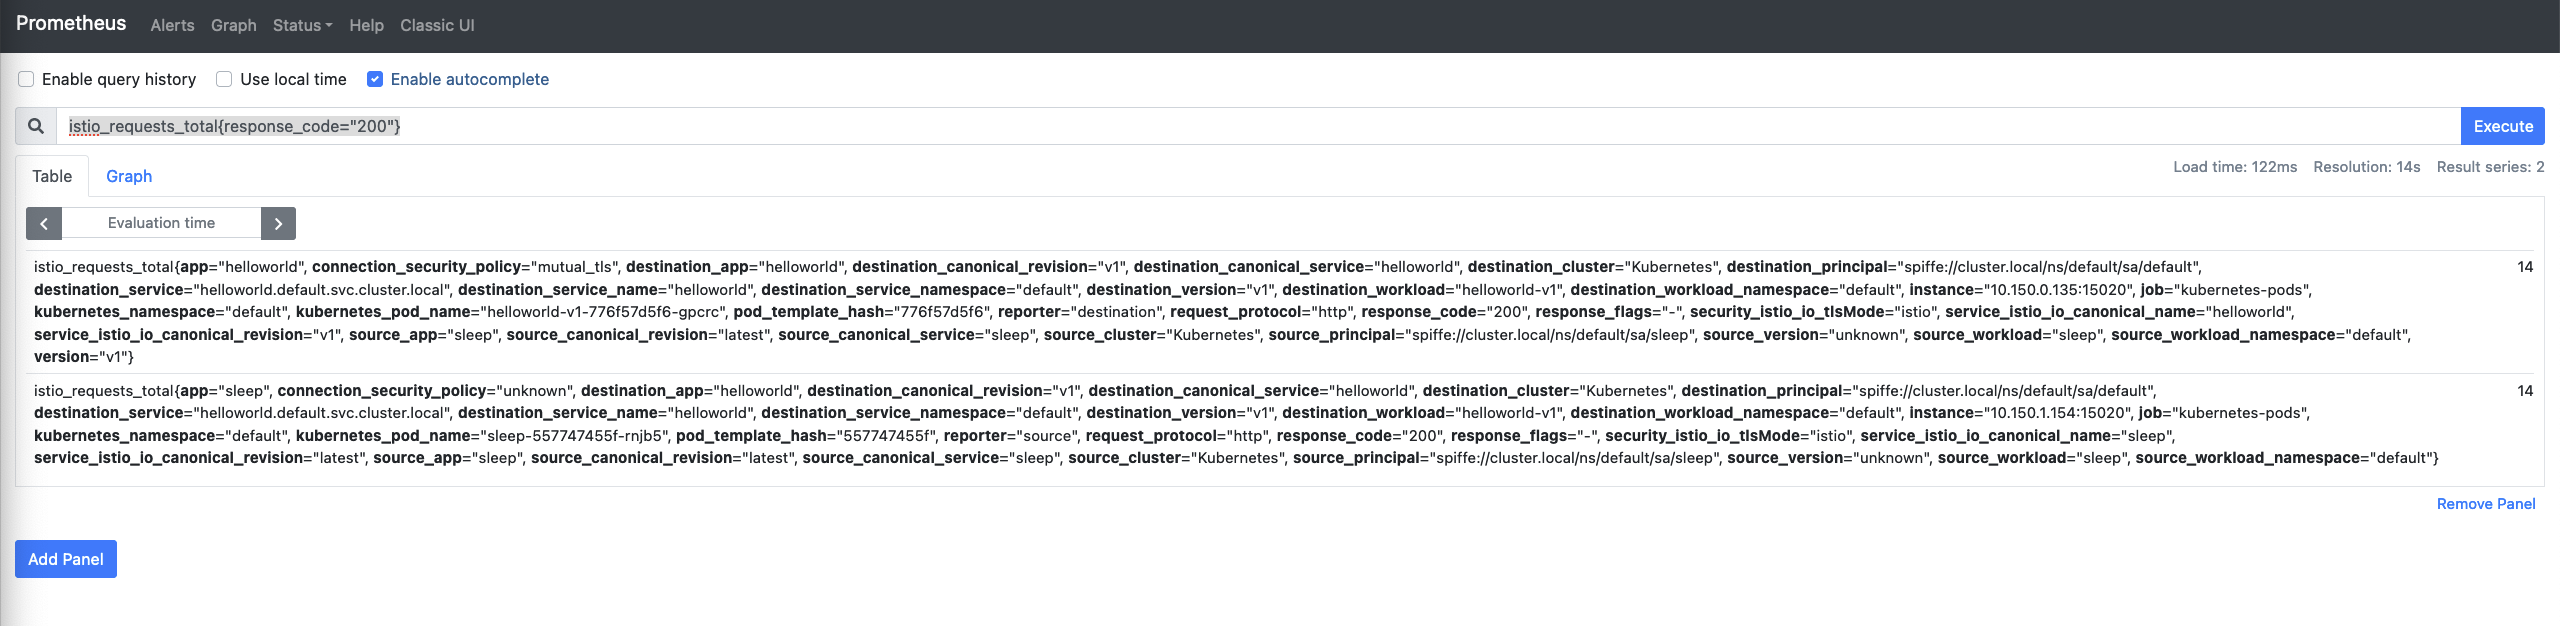
And search for the total istio requests with response code 200:
istio_requests_total{response_code="200"}
Expect a similar output to this:
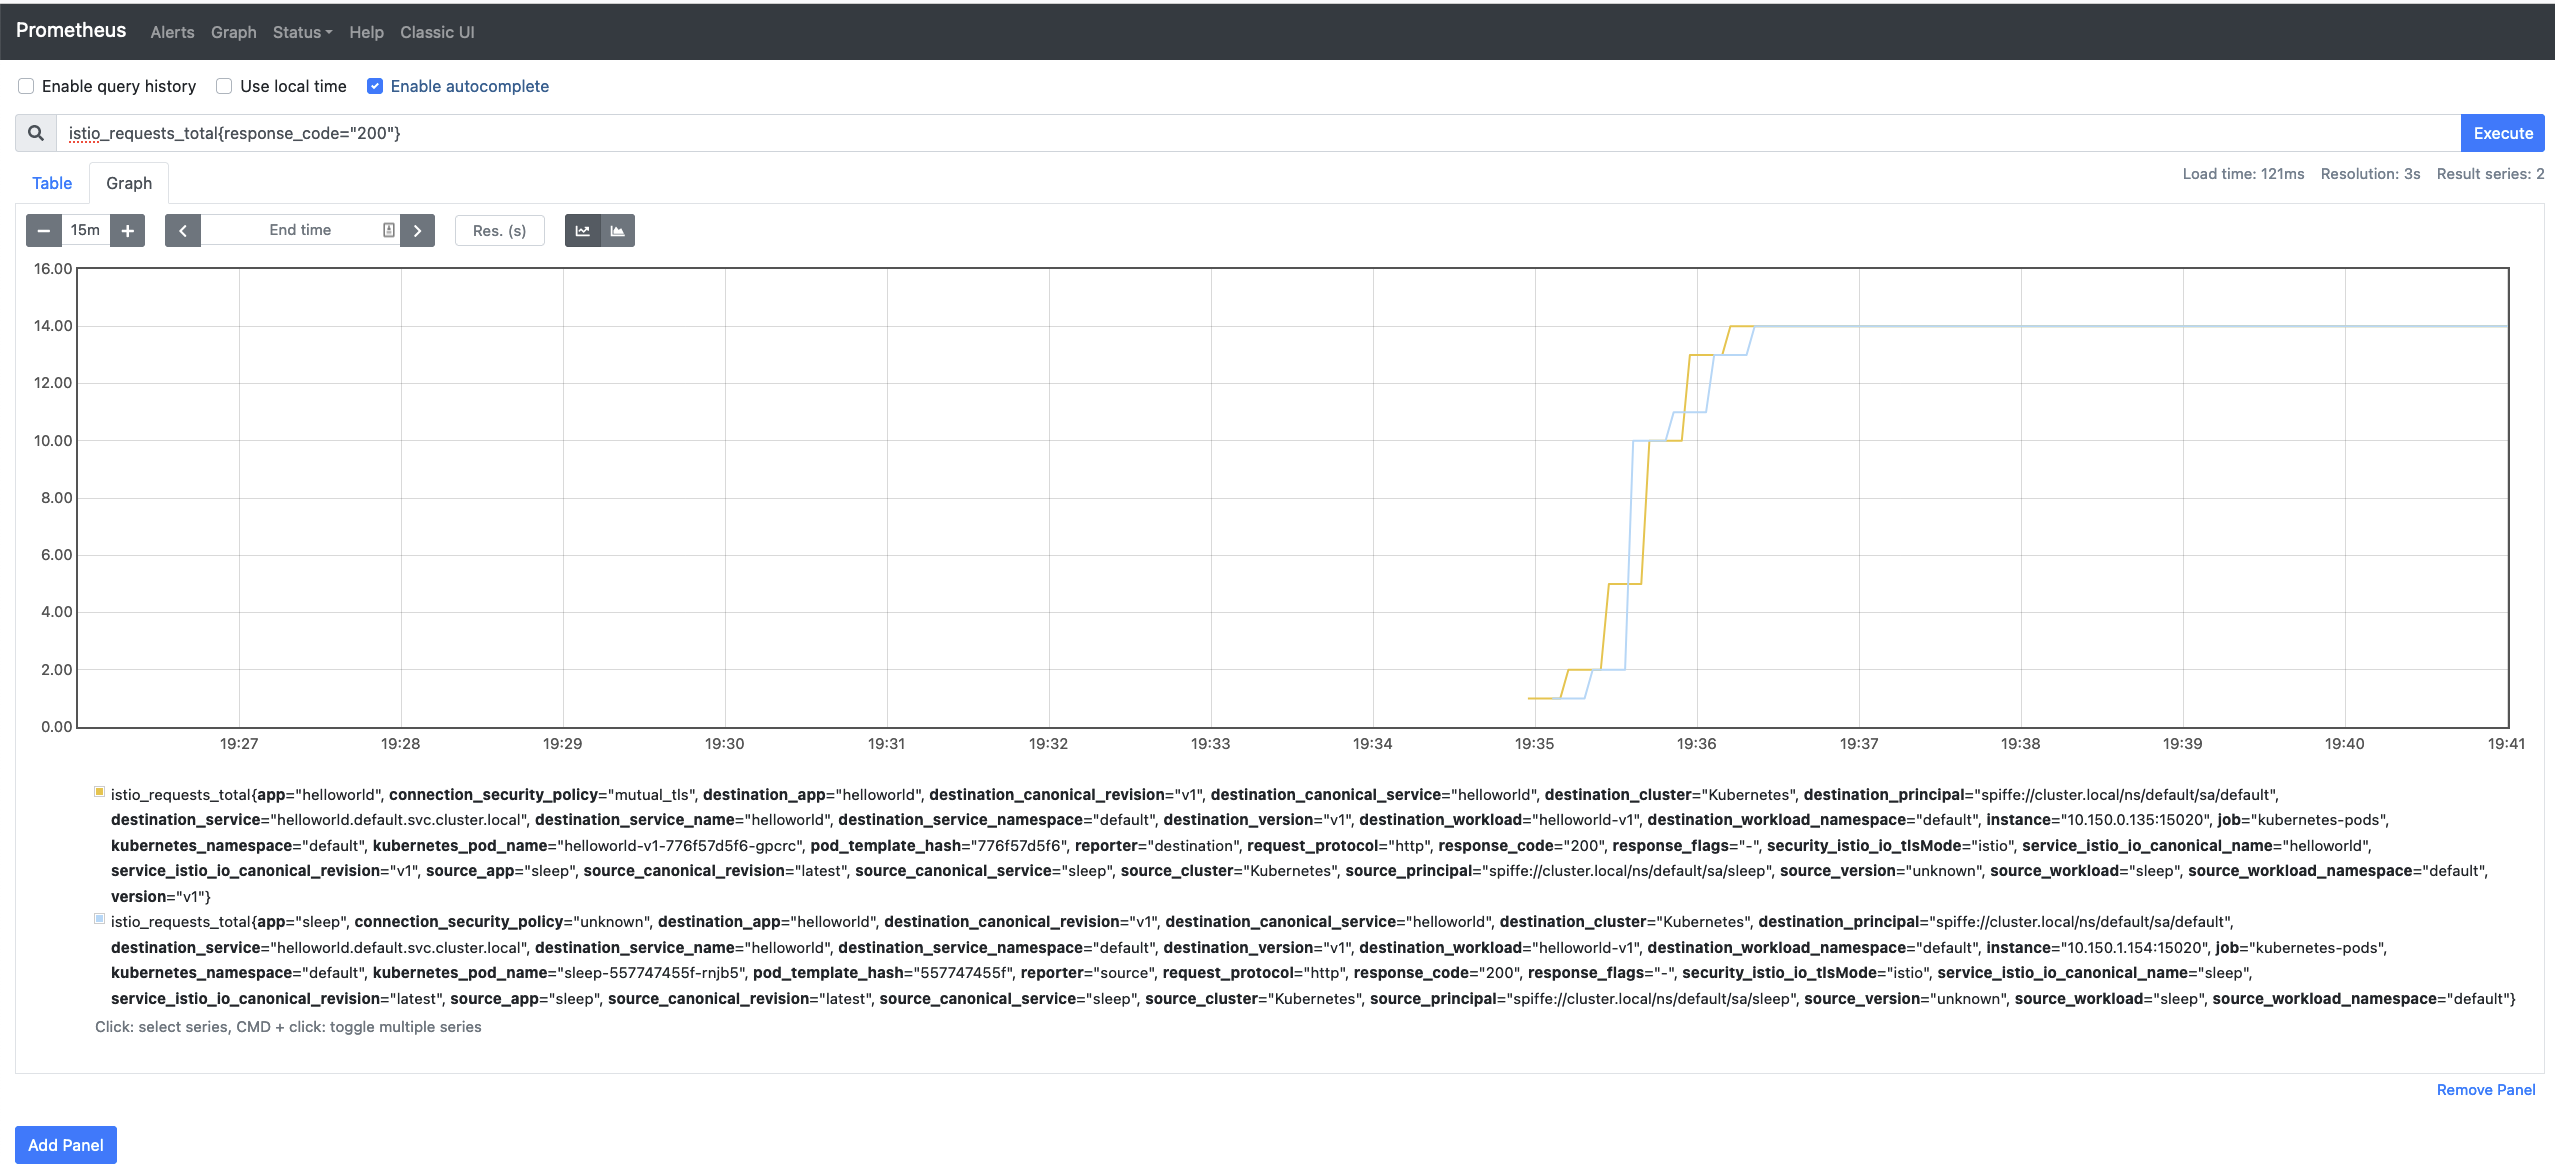
Switch to the graph view and change the time span to 15m, you should see something similar to this:
Congratulations! you have configured Prometheus and monitor metrics in 5 easy steps using Istio’s out of the box observability capabilities